Where Household Water Actually Goes
Published 1/16/2026 · 12 min read · Everyday calculators

Marco Bianchi — Home, DIY & motoring writer at OneKitly
Renovation · Materials
Checked against 6 sources
Ask people where household water goes and they say showers and taps. The metered answer, from the Water Research Foundation's Residential End Uses of Water study, is that toilets are the single largest indoor use in American homes: 33 gallons per household per day, 24% of indoor use, ahead of showers and faucets at 27 gallons and 20% each, clothes washers at 22 gallons, and leaks at 18 gallons — 13% of everything that enters the house, more than baths and dishwashers combined. Indoor use averages 58.6 gallons per person per day. EPA WaterSense separately puts the average family above 300 gallons a day including outdoor use, roughly 70% of it indoors. The arithmetic worth carrying: EPA states a showerhead leaking at 10 drips a minute wastes more than 500 gallons a year, so one drip per second — six times the rate — wastes more than 3,000 gallons a year, about 8 gallons a day, from a fault you can fix with a washer. Leaving the tap running while you brush your teeth, two minutes twice a day at the federal maximum of 2.2 gallons per minute, is 8.8 gallons a day. And a shower only beats a bath until flow rate times duration catches the tub up.
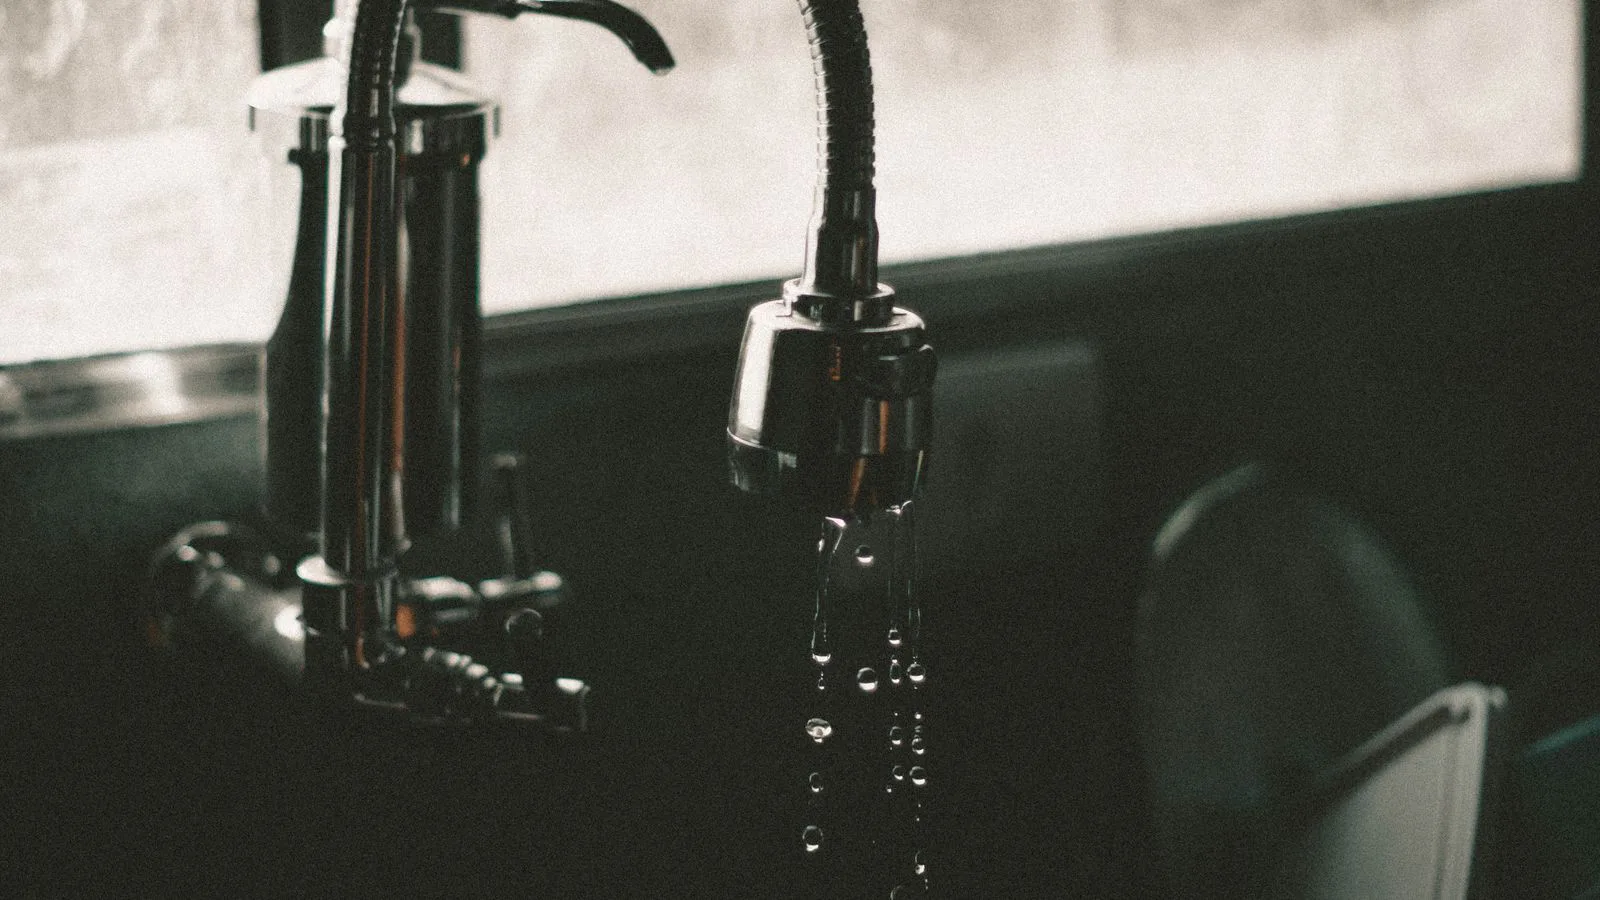
People picture taps and showers, and metered end-use studies say the biggest single line is somewhere else. Here is the ranked budget from named national agencies, plus the arithmetic that changes behaviour: the dripping tap, the running tap, and the shower flow rate at which a bath becomes the cheaper option.
Intuition puts the wrong thing first
Ask a household to guess its own water budget and the answers cluster around the things that feel wet: long showers, running taps, the dishwasher. The metered studies disagree. In the Water Research Foundation's Residential End Uses of Water study, which logged flow at fixture level in homes across the United States and Canada, the largest single indoor use is the toilet, at 33 gallons per household per day and 24% of indoor consumption. Showers and faucets follow at 27 gallons and 20% each. Clothes washers take 22 gallons, 16%. Nobody guesses the toilet, because flushing does not feel like using water.
The two numbers that follow are the ones this article is really about. Leaks account for 18 gallons per household per day, 13% of indoor use — more than baths, dishwashers and every miscellaneous use put together. And indoor consumption averages 58.6 gallons per person per day, down from 69.3 in the same study's 1999 predecessor, a 15% fall driven almost entirely by more efficient toilets and clothes washers rather than by anyone changing their behaviour.
One caveat before going further. EPA WaterSense states that the average American family uses more than 300 gallons a day at home with roughly 70% of it indoors, which implies about 210 gallons indoors — noticeably more than the 138 gallons per household the end-use study measured. The two are not in conflict; they are different samples with different household sizes, and the end-use figure comes from metered fixtures while the utility figure comes from billing records. Per-person numbers travel better than per-household numbers, which is why 58.6 gallons per person is the figure to compare yourself against.
The dripping tap, computed rather than guessed
A single drip is the smallest unit of water waste anyone can picture, which is exactly why the annual total is so surprising. EPA WaterSense publishes a usable anchor: a showerhead leaking at 10 drips per minute wastes more than 500 gallons a year. That is 5,256,000 drips over a year, so EPA's working drip is about 0.36 millilitres — a plausible size for a tap or showerhead, and the number the rest of this follows from.
Now scale it. One drip per second is 60 drips a minute, six times EPA's rate, so it is more than 3,000 gallons a year — about 8.2 gallons a day, every day, from a fault a washer would fix in ten minutes. That single tap is using more water per day than a dishwasher and a bath combined in the average American home, and it is doing it invisibly, at a rate slow enough that nobody thinks of it as a leak at all.
It is worth saying out loud that the drip size is the whole calculation, and it is not a constant. The US Geological Survey's own drip calculator works from a smaller quarter-millilitre drop, which puts one drip per second at about 2,100 gallons a year rather than 3,000. Both are right for the drop they assume. The useful conclusion is not a precise figure but a range and an order of magnitude: a slow drip costs thousands of gallons a year, and no plausible drop size makes it negligible.
The tap left running
A tap running while you brush your teeth is the classic example, and it deserves its reputation. American federal standards cap a bathroom faucet at 2.2 gallons per minute, and the WaterSense label at 1.5. Two minutes of brushing, twice a day, with the tap open at the federal maximum, is 8.8 gallons a day and 3,212 gallons a year for one person. That single habit is 15% of an average person's entire indoor consumption, and it produces no cleaner teeth whatsoever.
The toilet responds to the same kind of arithmetic and rewards it better, because the saving is automatic. The American federal maximum is 1.6 gallons per flush and the WaterSense threshold is 1.28. At five flushes a day that is 8 gallons against 6.4, so replacing one old fixture saves 584 gallons per person per year without anyone having to remember anything. Behaviour change needs to be repeated forever; a fixture change happens once.
Bath against shower, and exactly where they cross
The comparison is a single equation: a shower uses flow rate times duration, a bath uses a fixed volume, and the crossover is the bath volume divided by the flow rate. Everything hinges on what you assume for the bath, and this is where the two markets separate sharply. EPA WaterSense puts a full American bathtub at about 70 gallons. At the federal maximum showerhead flow of 2.5 gallons per minute, that is a 28-minute shower; at the 2.0 gpm WaterSense rate, 35 minutes. In other words, in a typical American bathroom the shower wins by a wide margin unless you are running it for more than half an hour.
The interesting part is that the 70-gallon figure is tub capacity to the overflow, not a normal fill. Assume a realistic half-fill of about 35 gallons and the crossover halves too: 14 minutes at 2.5 gpm, 17.5 minutes at 2.0 gpm. Now the question stops being rhetorical, because a 15-minute shower is an entirely ordinary thing. The lesson is that the answer depends far more on your own two numbers — how full you run the bath, how long you stand in the shower — than on any general claim about which is greener.
A low-flow head and a shorter shower are the same arithmetic
Total water is flow times time, so halving either halves the total, and the two are perfectly interchangeable on paper. An eight-minute shower at 2.5 gallons per minute is 20 gallons; the same eight minutes at the 2.0 gpm WaterSense rate is 16; and 6.4 minutes at 2.5 gpm is also 16. Three routes, one number.
In practice they are not equivalent, and the reason is behavioural rather than hydraulic. A restrictor changes the flow permanently and requires nothing of anybody afterwards; a shorter shower has to be chosen every single morning. Against that, restrictors have a well-documented rebound: people who find a weaker shower less satisfying stay in it longer, and part of the saving comes back. The robust answer is to do both and then check — read the meter before and after a month, because a household's own numbers settle the question far better than any general claim.
Leaks are the largest hidden line, at every scale
Leaks are 18 gallons per household per day in the end-use study — 13% of indoor consumption, more than baths, dishwashers and every other miscellaneous use combined. That is 6,570 gallons a year measured at the fixture. EPA's Fix a Leak Week campaign quotes a rounder and larger figure, nearly 10,000 gallons a year for the average household, because it counts outdoor and irrigation leaks as well as indoor ones. Both are describing the same phenomenon at different boundaries: a household loses thousands of gallons a year to water it never intended to use, and adds as much as 10% to its water bill doing so.
The silent version is the worst, because a meter does not complain. A toilet flapper that lets a thin film of water slide into the bowl makes no sound, leaves no mark, and can quietly account for most of the 18 gallons a day the end-use study attributes to leaks. The test takes ten minutes: a few drops of food colouring in the cistern, nobody flushes for half an hour, and if the bowl has taken on colour, the flapper is leaking. Do the same with the water meter — read it, use nothing for two hours, read it again — and any movement is a leak somewhere on your side of the meter.
The same phenomenon exists one level up, in the distribution network, and there it is enormous. Nationally, EPA estimates minor household leaks alone at nearly one trillion gallons of wasted water a year in the United States — a figure large enough to make any individual saving look decorative, and yet composed entirely of individual leaks. The domestic scale and the national scale are the same problem counted twice, and the household end of it is the only end you control.
| Country or region | Per person per day | Largest single line | Published by |
|---|---|---|---|
| United States | 58.6 gallons indoors | Toilets, 24% of indoor use | Water Research Foundation, Residential End Uses of Water (2016) |
| Germany | 122 litres | Bathing, showering and personal care, 36% | Umweltbundesamt and BDEW |
| France | 148 litres | Hygiene and cleaning, 93% against 7% for food and drink | Centre d'information sur l'eau |
| Spain | 128 litres (2022) | Down 3.9% on 2020 | Instituto Nacional de Estadística |
| Italy | 233 litres delivered per resident | Network losses: 35.2% never reaches a tap | ISTAT |
| Europe, average | 144 litres | Range from about 50 litres to over 200 between member states | European Environment Agency |
Frequently asked questions
- What is the single largest use of water in a home?
- Indoors, in American homes, the toilet: 33 gallons per household per day, 24% of indoor use, ahead of showers and faucets at 20% each. Counting outdoor use as well, landscape irrigation dominates in dry regions — EPA WaterSense puts roughly 30% of the average family's 300-plus gallons a day outdoors, and much more than that in the arid West.
- How much does a dripping tap actually waste?
- At one drip per second, more than 3,000 gallons a year — about 8.2 gallons a day. That follows from EPA's own published anchor of more than 500 gallons a year for a showerhead dripping 10 times a minute, scaled by six. The US Geological Survey assumes a smaller quarter-millilitre drop and gets about 2,100 gallons instead. The drop size is the whole calculation, so treat the answer as a range: thousands of gallons a year, either way.
- Is a shower always better than a bath?
- Only until flow rate times duration catches up with the tub. EPA puts a full American bathtub at about 70 gallons, so at the federal maximum showerhead flow of 2.5 gallons per minute the crossover is 28 minutes — the shower wins comfortably. But a realistic half-fill of 35 gallons moves the crossover to 14 minutes, which is an ordinary shower length. Measure your own head with a bucket and a stopwatch before assuming.
- How do I find a leak I cannot see?
- Two tests, both free. For the toilet, put a few drops of food colouring in the cistern and do not flush for half an hour; colour appearing in the bowl means the flapper is leaking. For everything else, read the water meter, use no water at all for two hours, and read it again — any movement is a leak on your side of the meter. EPA puts the average household's leaks at nearly 10,000 gallons a year and up to 10% of the water bill.
- Is a low-flow showerhead better than a shorter shower?
- On paper they are identical, because total water is flow times time: eight minutes at 2.5 gallons per minute is 20 gallons, and so is 6.4 minutes at 2.5 or eight minutes at 2.0 with a bit more saving. In practice the head wins on reliability — it never forgets — while the shorter shower has to be chosen every morning. Watch for rebound, though: a weaker shower that feels less satisfying tends to get longer.
- Why do national water figures differ so much between countries?
- Partly real behaviour, partly definitions. The United States runs high because outdoor irrigation is counted and is enormous in dry states: EPA WaterSense puts the average family above 300 gallons a day with roughly 30% of it outdoors. Indoor use alone is 58.6 gallons per person. Always check whether a figure is indoor-only, whether it includes irrigation, and whether it is metered at fixtures or derived from billing — those three choices explain most of the spread.
Articles you may find interesting
All guides →Related tools
Sources
- US EPA WaterSense — How We Use Water, and Fix a Leak Week
- Water Research Foundation — Residential End Uses of Water, Version 2 (2016)
- Umweltbundesamt — Wassernutzung privater Haushalte
- Centre d'information sur l'eau — Quels sont les usages domestiques de l'eau ?
- European Environment Agency — Water savings for a water-resilient Europe
- ISTAT — Le statistiche sull'acqua — Giornata mondiale dell'acqua
Spotted a mistake in this article?