Am I Overweight? Why One Number Cannot Say
Published 4/22/2026 · 13 min read · Health calculators

The World Health Organization puts overweight at a BMI of 25 and above and obesity at 30 and above, with classes at 30–34.9, 35–39.9 and 40 or more. Like the underweight line, these are population screening thresholds rather than diagnoses, but they fail differently and it is worth being precise about how. BMI is mass over height squared, so it reads muscle and fat identically: at 1.85 m and 100 kg the reading is 29.2 whether the fat-free mass is 88 kg or 70 kg. And it has no term at all for where fat sits, which is the variable that matters most — people with a normal BMI and central obesity have been found to carry a higher mortality risk than people at the same BMI without it. That is why waist measures exist alongside BMI. The WHO's thresholds are a waist of 94 cm in men and 80 cm in women for increased risk, 102 cm and 88 cm for substantially increased; NICE's 2025 guidance classifies a waist-to-height ratio of 0.5 to 0.59 as increased central adiposity and 0.6 or more as high, and tells people to keep their waist under half their height. The two measures routinely disagree — and in January 2025 a Lancet commission proposed dropping BMI as the definition of obesity altogether.
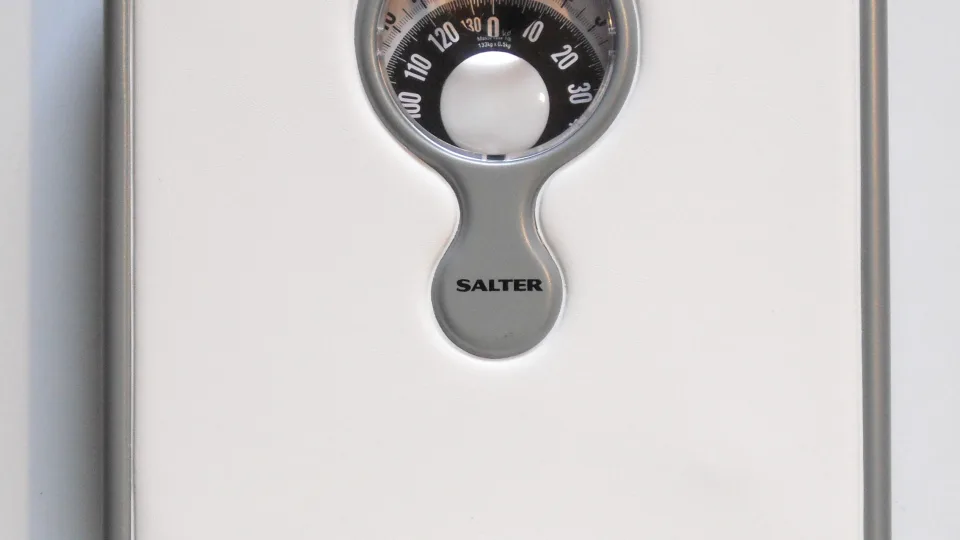
BMI reads muscular bodies as heavy and cannot see where fat sits at all — which is exactly why the waist measures exist. Here are the published waist and waist-to-height thresholds, a worked case where BMI and waist give opposite answers, an honest account of the contested mortality curves, and the 2025 shift toward defining obesity by adiposity and organ function rather than by a ratio.
Failure mode one: mass with no term for what it is
Take one body at 1.85 m and 100 kg. The BMI is 29.2 — overweight, close to the obesity line. Now vary only the composition. At 12% body fat, fat-free mass is 88 kg and the fat-free mass index is 25.7 kg/m². At 20%, fat-free mass is 80 kg and the index is 23.4. At 30%, it is 70 kg and 20.5. Three different bodies, three very different physiologies, one identical BMI. In feet and pounds the same point lands at 6 feet 1 inch and 220 pounds, which reads 29.0.
This has been measured rather than argued. Ode and colleagues compared BMI against measured percentage body fat in 226 college athletes and 213 non-athletes, and reported sensitivity of 0.83 to 1.0 alongside specificity of 0.27 to 0.66 in male athletes, male non-athletes and female athletes. A specificity of 0.27 means that among people who are not high in body fat, roughly three quarters were nevertheless classified as if they were. That is what a screening test tuned to miss few true cases looks like from the other side.
Failure mode two: it cannot see where the fat is
This is the more consequential blind spot, because distribution carries more information than mass. Sahakyan and colleagues analysed 15,184 adults from the third US national health and nutrition survey, classifying people jointly by BMI and by waist-to-hip ratio. A man with a normal BMI of 22 who also had central obesity had a higher total mortality risk than a man of the same BMI without it — a hazard ratio of 1.87, with a confidence interval of 1.53 to 2.29. In women the corresponding excess was 48%. The people with the worst long-term survival in that analysis were not the heaviest; they were the ones a BMI screen would have cleared.
The waist thresholds, and a case where the two measures disagree
The World Health Organization's waist circumference thresholds are 94 cm for men and 80 cm for women as the point of increased risk, and 102 cm and 88 cm as the point of substantially increased risk; the corresponding US thresholds are published directly in inches, at more than 40 inches for men and more than 35 for women. NICE's 2025 guideline adds a ratio that needs no sex-specific table at all: divide waist by height, and read 0.4 to 0.49 as healthy central adiposity, 0.5 to 0.59 as increased, and 0.6 or more as high. NICE recommends it for anyone with a BMI below 35, of either sex and any ethnicity, explicitly including people with high muscle mass — and phrases the whole thing as keeping your waist to less than half your height. We cover where exactly the tape goes in a separate article on the waist-to-hip ratio.
Now put the two measures on the same person and watch them separate. A woman of 1.70 m weighing 68 kg has a BMI of 23.5, comfortably normal, and a calculator asked whether she is overweight would say no. Measure her waist at 92 cm and the ratio is 0.541 — inside NICE's increased central adiposity band, and above the WHO's 88 cm threshold for substantially increased risk. Half her height would be 85 cm. Now the other direction: a man of 1.85 m weighing 100 kg reads 29.2, firmly overweight, but with a waist of 84 cm his ratio is 0.454, which NICE calls healthy, and half his height is 92.5 cm. In feet and inches: 5 feet 7 inches and 150 pounds gives a BMI of 23.5 with a 36-inch waist, a ratio of 0.537 and a measurement above the 35-inch threshold; 6 feet 1 inch and 220 pounds gives 29.0 with a 33-inch waist and a ratio of 0.452.
The obesity paradox, told honestly
In 2013 Flegal and colleagues pooled 97 studies, 2.88 million people and more than 270,000 deaths, and reported that overweight — a BMI of 25 to 30 — carried a hazard ratio of 0.94 against the normal range, and that grade 1 obesity carried 0.95, a confidence interval straddling 1. Only at 35 and above did mortality clearly rise, to 1.29. Three years later the Global BMI Mortality Collaboration, with individual data on 10.6 million adults, reported 1.07 for 25 to 27.5 and 1.45 for 30 to 35. Both are competent analyses of real data and they disagree in the middle of the range.
What is contested is not the arithmetic but the design, and three specific choices explain most of the gap. First, the reference band: Flegal compares against 18.5 to 25, which includes people at the thin end where mortality is itself elevated, so the comparison group carries excess risk of its own and everything measured against it looks better. The 2016 collaboration used 22.5 to 25 instead. Second, smoking: smokers are lighter and die sooner, which pushes mortality into the lower BMI bands; the 2016 analysis excluded ever-smokers from its primary analysis. Third, reverse causation: illness causes weight loss before it causes death, so a study that counts early deaths attributes them to low weight. The 2016 analysis excluded people with chronic disease at entry and required five years of follow-up before counting anything.
Where the two agree is worth saying as clearly as where they differ. Both find clearly raised mortality at a BMI of 35 and above; both find that the curve is not a straight line; and neither finds any threshold at which a single number becomes a statement about an individual. The honest summary is that the mortality curve is J-shaped, that its exact shape near the bottom of the overweight range depends on choices that reasonable people make differently, and that this is a poor foundation for anyone's decision about their own body.
Why the cut-offs move between populations
Because the relationship between BMI and body fat is not the same everywhere. The WHO's 2004 expert consultation on Asian populations concluded that the proportion of people at high risk of type 2 diabetes and cardiovascular disease is substantial at BMIs below the existing overweight cut-off, and proposed additional public health action points at 23.0, 27.5, 32.5 and 37.5. NICE turned that into practice guidance in 2025: for people from South Asian, Chinese, other Asian, Middle Eastern, Black African or African-Caribbean family backgrounds, overweight is defined as a BMI of 23 to 27.4 and obesity as 27.5 or above, with the higher obesity classes lowered by the same 2.5 units.
The practical size of that shift is easy to lose in the abstraction, so here it is in weight. For someone 1.70 m tall, the standard overweight line falls at 72.2 kg and the lowered one at 66.5 kg; the standard obesity line falls at 86.7 kg and the lowered one at 79.5 kg. At 5 feet 7 inches the same lines are 159.6 and 146.9 pounds, and 191.6 and 175.6 pounds. The same body gets a different label depending on which table is applied — which is the clearest possible demonstration that the label is a convention chosen for a purpose, not a property of the body.
The 2025 change: from a ratio to a clinical finding
In January 2025 a commission convened by The Lancet Diabetes & Endocrinology, chaired by Francesco Rubino and endorsed by more than seventy-five medical organisations, proposed that obesity should stop being defined by BMI at all. Its framework splits the condition in two: preclinical obesity, where excess adiposity is present but organ function is intact and the situation is a risk factor, and clinical obesity, where excess adiposity is directly impairing the function of organs or tissues and the situation is an illness in its own right. The distinction is made by looking for organ dysfunction, not by reading a number off a chart.
The commission also says something practical about measurement that fits everything above. It recommends that BMI alone should not be used to confirm excess adiposity: at least one further anthropometric measure — waist circumference, waist-to-hip ratio or waist-to-height ratio, with thresholds set by age, sex and ethnicity — should be added. Above a BMI of 40 it accepts that no further measurement is needed. Whether that framework becomes ordinary practice in every country is not settled, and the calculators on this site still compute the classical categories because those are what most services still use. But the direction of travel is away from the single number, and it is worth knowing that the people who write the definitions think so too.
| BMI band | Hazard ratio — Global BMI Mortality Collaboration (2016), reference 22.5–25.0 | Comparable band — Flegal (2013), reference 18.5–25.0 | What the disagreement is about |
|---|---|---|---|
| 15.0–18.5 | 1.51 (1.43–1.59) | Inside the reference band | Flegal's reference includes the thin, so his comparison group has its own excess risk |
| 18.5–20.0 | 1.13 (1.09–1.17) | Inside the reference band | Same effect, and it drags every ratio measured against that band downward |
| 20.0–25.0 | The band of lowest risk in the restricted analysis | The reference band | The two studies do not disagree here |
| 25.0–27.5 | 1.07 (1.07–1.08) | Overweight, 25–30: 0.94 (0.91–0.96) | The direction reverses: this is the finding people mean by the obesity paradox |
| 27.5–30.0 | 1.20 (1.18–1.22) | Same band as above | Splitting 25–30 in two shows the risk is not flat inside it |
| 30.0–35.0 | 1.45 (1.41–1.48) | Grade 1 obesity: 0.95 (0.88–1.01) | The largest disagreement in the whole literature |
| 35.0–40.0 | 1.94 (1.87–2.01) | Grades 2–3, 35 and above: 1.29 (1.18–1.41) | Both find raised mortality here; they disagree only on how much |
| 40.0–60.0 | 2.76 (2.60–2.92) | Inside the 35-and-above band | Pooling everything above 35 hides how steeply the curve rises |
Frequently asked questions
- I lift weights and my BMI says overweight. Should I ignore it?
- Not ignore it — replace it. The measured evidence is that BMI has poor specificity in athletic populations, so a reading in the overweight band tells you very little on its own. NICE's answer is the waist-to-height ratio, which it recommends explicitly for people with high muscle mass at a BMI below 35: keep your waist under half your height. A body-composition measurement answers the same question more precisely. What none of this changes is that blood pressure, glucose and lipids are measured, not inferred.
- Which is better, waist circumference or waist-to-height?
- They answer the same question with different amounts of context. Waist circumference has fixed thresholds that must be set separately by sex and, in most guidance, by population — 94 and 102 cm for men, 80 and 88 cm for women in the WHO scheme. The waist-to-height ratio divides that measurement by your own height, which removes the need for most of those tables: NICE applies 0.5 and 0.6 to both sexes and all ethnicities at a BMI below 35. Neither is a diagnosis. If you only want to remember one thing, NICE's phrasing is the compact one: keep your waist to less than half your height.
- Does the obesity paradox mean being overweight is safe?
- It means the mortality curve is not a straight line and that its shape at the low end of the overweight range is genuinely contested. Flegal's 2013 meta-analysis found a hazard ratio of 0.94 for a BMI of 25 to 30; the 2016 collaboration, using a narrower reference band and excluding smokers and people with existing disease, found 1.07 for 25 to 27.5 and 1.20 for 27.5 to 30. Both found clearly raised mortality above 35. What neither can do is tell any individual what their own risk is, which depends on where fat sits, on fitness, and on blood pressure, glucose and lipids that have to be measured.
- Why does the same body get a different label in different countries?
- Because the label is a decision, not a measurement. The measurement is BMI; the label is where a health system chooses to draw a line, and it draws it where acting is likely to help the population it serves. The relationship between BMI, body fat and metabolic risk differs between populations, so the line differs too. NICE, for example, defines overweight as a BMI of 23 to 27.4 and obesity as 27.5 or above for several family backgrounds — at 1.70 m, that moves the obesity line from 86.7 kg to 79.5 kg for the same person.
- If BMI is so limited, why do calculators still use it?
- Because it costs nothing, needs only a scale and a tape, and is comparable across decades and countries — which is exactly what a population screening measure has to be. Its weaknesses are the price of that. The reasonable use is the one the guidelines describe: compute it, add a waist measurement, and treat the pair as a prompt for a conversation rather than an answer. The 2025 Lancet commission goes further and asks for at least one non-BMI measure before excess adiposity is even confirmed, which is the same instinct written into a definition.
Articles you may find interesting
All guides →Related tools
This article explains what the overweight and obesity cut-offs are, what they measure and where they fail. It is general information, not medical advice, and it is not an assessment of you or a judgement about you. A BMI category is a screening result, not a diagnosis and not a statement about anybody's health, effort or worth. Nothing here is a target, and this page does not tell you what to weigh or what to do. Health risk is decided by many things a scale cannot see — blood pressure, blood glucose, lipids, fitness, sleep, family history, medication — and the only useful next step, if you want one, is a conversation with a doctor who can measure those. If weight has been a difficult subject for you, or if thoughts about food and your body take up a large part of your day, that is worth raising with a doctor too; it is common and it is treatable.
Sources
- World Health Organization, Nutrition Landscape Information System — BMI definitions for adults — overweight at 25 and obesity at 30, from Technical Report Series 854 (1995)
- The Lancet (Global BMI Mortality Collaboration, 2016;388:776–786) — Body-mass index and all-cause mortality: individual-participant-data meta-analysis of 239 prospective studies in four continents
- JAMA (Flegal KM, Kit BK, Orpana H, Graubard BI, 2013;309:71–82) — Association of all-cause mortality with overweight and obesity using standard body mass index categories
- Annals of Internal Medicine (Sahakyan KR et al., 2015;163:827–835) — Normal-weight central obesity: implications for total and cardiovascular mortality
- NICE guideline NG246 (14 January 2025) — Overweight and obesity management — identifying and assessing overweight, obesity and central adiposity
- The Lancet Diabetes & Endocrinology (Rubino F et al., 2025) — Definition and diagnostic criteria of clinical obesity — the Commission report
Spotted a mistake in this article?