FFMI: The Number BMI Cannot Give You
Published 12/1/2025 · 13 min read · Sport calculators

BMI is body mass divided by height squared. It has one input for your body — the number on the scale — so it cannot distinguish a pound of muscle from a pound of fat, and a lean, heavily trained person is routinely classed overweight by it. FFMI fixes the input. Strip the fat off first: fat-free mass = weight × (1 − body-fat fraction), then FFMI = 703 × fat-free mass in pounds ÷ height in inches squared. A man of 6 ft 1 in and 210 lb at 12% body fat has a BMI of 27.70, which sits in the overweight range, and an FFMI of 24.38. The same height and weight at 30% body fat gives an identical BMI of 27.70 and an FFMI of 19.39 — a gap of five whole points that BMI cannot see. There is a normalisation step for height, FFMI + 6.1 × (1.8 − height in metres), which adjusts by about ±0.6 for someone 10 cm from 1.8 m. But FFMI is built on an estimate, not a measurement: every percentage point of body-fat error moves FFMI by BMI ÷ 100, so five points of error moves this man by 1.39.
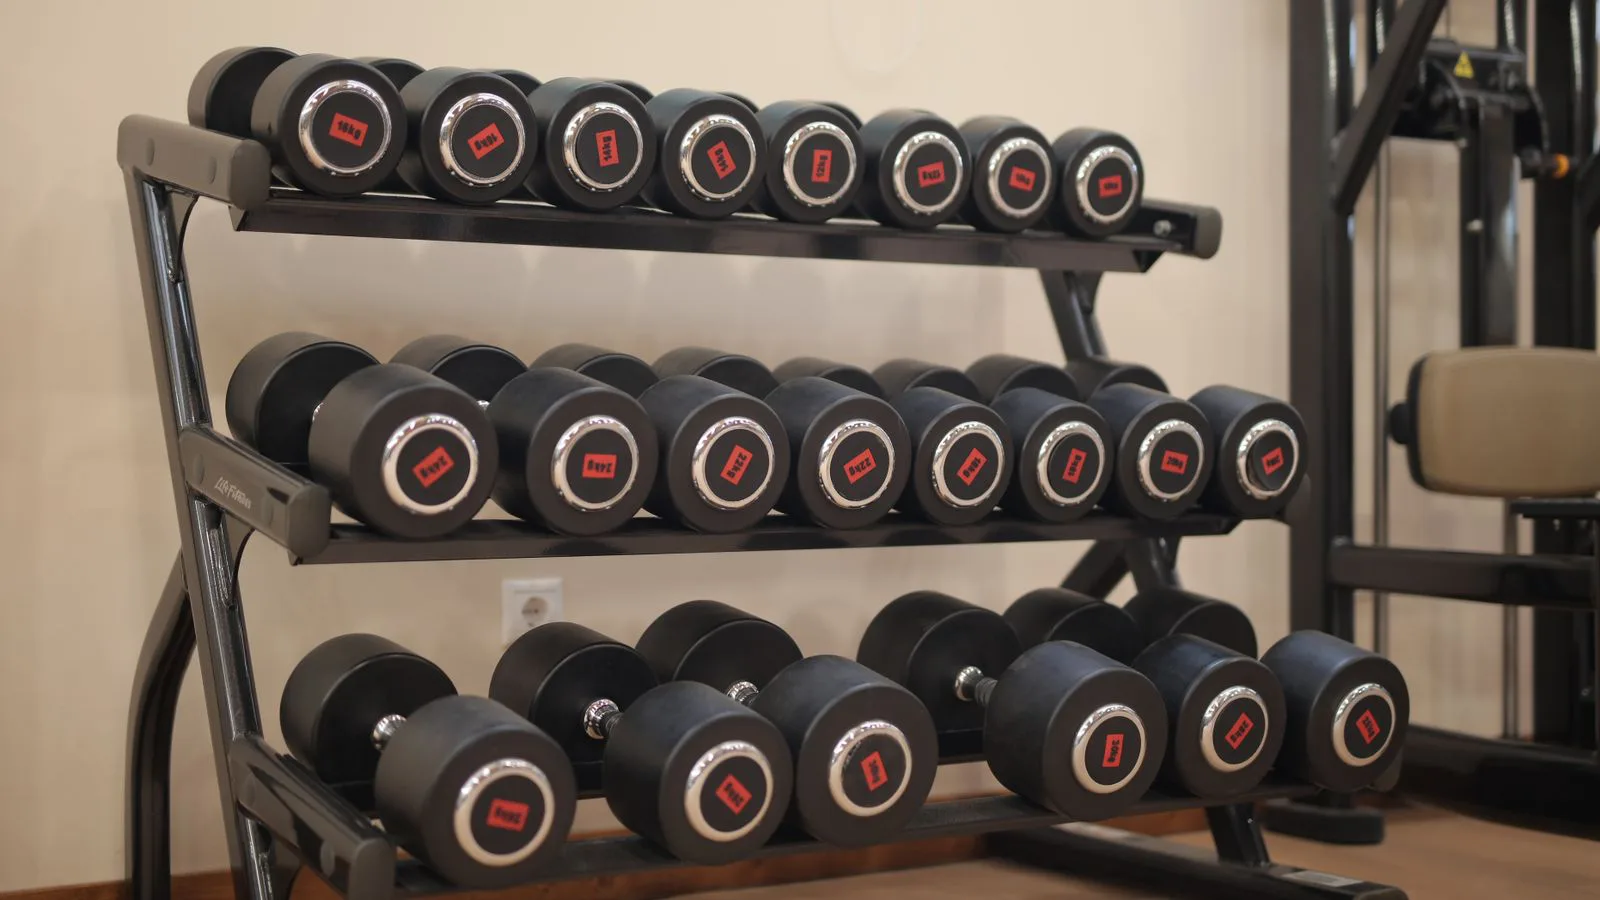
BMI weighs you and divides by your height squared. It cannot tell muscle from fat, which is why lean athletes get classed overweight. FFMI removes the fat first — and inherits every error in the body-fat estimate it is built on.
BMI has one input for your body, and it is the scale
Body mass index is weight divided by height squared — in imperial units, 703 × pounds ÷ inches squared. That is the whole calculation. It was devised in the nineteenth century as a way of describing populations, and it does that job well: across thousands of people, average mass at a given height tracks average adiposity closely enough to be useful for public health. What it cannot do is look inside one person. Two bodies of the same height and the same weight get the same BMI whatever they are made of.
The consequence shows up wherever people carry a lot of muscle. A rower, a rugby forward, a sprinter and a heavy-training recreational lifter can all land in the overweight band of a chart designed to flag excess fat. The chart is not lying — it is answering a question about mass, and their mass is genuinely high. It is simply not answering the question they asked. Both the WHO and the CDC state this limitation directly in their own guidance on BMI, which is worth remembering the next time a health app announces the number without one.
FFMI, exactly
FFMI keeps the shape of BMI and changes the numerator. First compute fat-free mass: fat-free mass = body weight × (1 − body-fat percentage ÷ 100). Then FFMI = 703 × fat-free mass in pounds ÷ height in inches squared, using the same 703 conversion factor that imperial BMI uses. A man of 6 ft 1 in — 73 inches, so 5,329 square inches — weighing 210 lb at 12% body fat has 184.8 lb of fat-free mass, and 703 × 184.8 ÷ 5,329 = 24.38.
There is a second step you will see quoted alongside it. Fat-free mass does not scale with the square of height as cleanly as total mass does, so taller people tend to score slightly lower on raw FFMI and shorter people slightly higher, for reasons of geometry rather than muscularity. The normalisation corrects towards a common reference height of 1.8 m: normalised FFMI = FFMI + 6.1 × (1.8 − height in metres). Note that this step is metric even if the rest of your arithmetic is not — 73 inches is 1.854 m, so our man's adjustment is 6.1 × (1.8 − 1.854) = −0.33, taking his 24.38 to 24.05. Someone at 1.70 m gains 0.61 and someone at 1.90 m loses 0.61. Below about 0.3 of a point the adjustment is smaller than the measurement error underneath it.
One person, two indices, one contradiction
Take the man in the table again: 6 ft 1 in, 210 lb, 12% body fat. His BMI is 703 × 210 ÷ 5,329 = 27.70, which puts him in the overweight band of every standard chart. His FFMI is 24.38, which is high — he is carrying 184.8 lb of fat-free mass on a 73-inch frame. Both numbers are arithmetically correct and they point in opposite directions, because they are answering different questions. BMI asks how much of him there is. FFMI asks how much of him is not fat.
Row C makes the point sharper. Same height, same 210 lb on the scale, but 30% body fat instead of 12%. BMI is byte-for-byte identical at 27.70, because BMI never saw the difference. FFMI falls from 24.38 to 19.39. Five points of index separate two people that BMI puts in the same box, and those five points correspond to 37.8 lb of fat-free mass. Row D is the other useful comparison: at 245 lb and 35% body fat the BMI is 32.32, the highest in the table, and yet the fat-free mass — 159.3 lb — is lower than B's 184.8 lb. The heaviest person here has less muscle, bone and organ mass than the second-heaviest, and only one of the two indices notices.
FFMI inherits every error in your body-fat estimate
BMI needs two measurements and both are easy to take accurately. FFMI needs three, and the third — body-fat percentage — is not a measurement at all. Skinfold calipers, bioelectrical impedance scales, hydrostatic weighing and DEXA are all estimates, each built on its own model of what a body is made of, and they routinely disagree with one another by several percentage points on the same person on the same day. That disagreement does not stay in the body-fat number. It propagates straight through into FFMI.
The propagation has a clean closed form, and it is worth knowing because almost no page states it. Hold weight and height fixed and differentiate: each single percentage point of body-fat error moves FFMI by exactly BMI ÷ 100. For our 210 lb man at 6 ft 1 in that is 27.70 ÷ 100 = 0.277 index points per percentage point. Three points of body-fat error — a modest estimate for a caliper reading taken by two different people — moves his FFMI by 0.83. Five points moves it by 1.39. Concretely: the same man, same scale, same day, read at 9% body fat scores 25.21 and read at 17% scores 22.99. A 2.2-point range, produced entirely by the measurement, not by the body.
Two practical consequences. First, an FFMI quoted to two decimal places is false precision — the honest way to report it is as a range, or with the body-fat method named beside it. Second, if you are tracking FFMI over time, use the same method, the same device and ideally the same operator every time. A consistent method that is biased by three points will still show the true direction of change; switching methods between measurements manufactures a change that never happened.
About the number 25
You will not read far about FFMI before meeting the claim that 25 is the natural limit. Here is where it comes from, precisely. In 1995 Kouri, Pope, Katz and Oliva published a study in the Clinical Journal of Sport Medicine of 157 male athletes — 83 who reported using anabolic-androgenic steroids and 74 who reported never having used them. Among the non-users, normalised FFMI values extended up to about 25.0. Many of the users exceeded that, and some exceeded 30. That is the entire empirical basis of the figure, and the 6.1 height normalisation everyone uses comes from the same paper.
Read carefully, what that study reports is the upper edge of one distribution, in one sample, of one sex, from one country, in one decade, with drug use self-reported and body fat estimated. An upper edge in 74 men is not a physiological wall. Distributions have tails; a larger or differently selected sample will contain people beyond the largest value in a smaller one. Body composition also varies systematically with skeletal frame, limb proportions and ancestry, none of which FFMI accounts for. And, as shown above, the index itself carries roughly a point of measurement uncertainty, which is a substantial fraction of the distance most people are arguing over.
So the honest reading is this. An FFMI near 25 describes someone at the upper end of what was observed in that sample. It is not a threshold, it is not a pass mark, and it is emphatically not a test for drug use. Using an index with more than a point of built-in error, derived from a thirty-year-old sample of a specific population, to make an accusation about a specific individual is a misuse of the number that its own authors did not propose. If you want to know how much muscle you carry relative to your frame, FFMI is a reasonable descriptive tool. It cannot tell you what anyone has taken.
What FFMI is actually good for
Its best use is longitudinal, on yourself. Body weight alone cannot tell you whether a training block added muscle, lost fat, or did some of each, because all three can leave the scale unchanged. FFMI separates the strands. If your weight is flat and your FFMI has risen by a point over three months with the same measurement method, you have gained fat-free mass and lost fat — the thing people mean by recomposition — and no scale reading would have shown it.
It is also a sane way to size a strength expectation. Fat-free mass, not body weight, is what produces force, which is why absolute lifts and lean mass track together far more tightly than lifts and scale weight do. Two people at the same body weight with FFMIs of 24 and 19 are not competing in the same event. Where FFMI is weakest is as a cross-sectional judgement: comparing your index to a stranger's tells you very little, because you do not know their body-fat method, their frame, or their measurement day, and any one of those can move the number by more than the difference you are looking at.
| Person | Body weight | Body fat | BMI | BMI band | FFMI |
|---|---|---|---|---|---|
| A | 155 lb | 12% | 20.45 | Normal (18.5–24.9) | 17.99 |
| B | 210 lb | 12% | 27.70 | Overweight (25–29.9) | 24.38 |
| C | 210 lb | 30% | 27.70 | Overweight (25–29.9) | 19.39 |
| D | 245 lb | 35% | 32.32 | Obesity (30+) | 21.01 |
Frequently asked questions
- Why does BMI call a lean, muscular person overweight?
- Because BMI has no way to know what the weight is made of. Its only body input is total mass, so a pound of muscle and a pound of fat are identical to it. Muscle is denser than fat, which means a well-muscled person of a given height weighs more than a less-muscled one of the same visible size — and BMI reads that extra weight the same way it reads extra fat. The 6 ft 1 in, 210 lb man in this article is a clean example: BMI 27.70, squarely in the overweight band, at 12% body fat. The classification is not a mistake in the arithmetic. It is the honest answer to a question about mass being read as an answer to a question about fat.
- How do I calculate FFMI?
- Three steps. First, fat-free mass = body weight × (1 − body-fat percentage ÷ 100). Second, FFMI = 703 × fat-free mass in pounds ÷ height in inches squared. Third, if you want the normalised version, convert your height to metres and add 6.1 × (1.8 − height in metres). Worked through for a man of 6 ft 1 in and 210 lb at 12% body fat: fat-free mass is 210 × 0.88 = 184.8 lb; 73 inches squared is 5,329; FFMI is 703 × 184.8 ÷ 5,329 = 24.38; and since 73 inches is 1.854 m, the normalisation subtracts 0.33, giving 24.05. Report the body-fat method you used alongside the result — without it, the number cannot be compared to anything.
- Can FFMI tell whether someone has used steroids?
- No, and it should not be used to try. The 25 figure comes from a single 1995 study in which the normalised FFMI of 74 men reporting no steroid use extended up to about that value. That is the maximum observed in one sample of one population, with drug use self-reported and body fat estimated rather than measured. Larger or differently selected samples will contain people above it, since distributions have tails. On top of that, the index itself moves by BMI ÷ 100 for every percentage point of body-fat error — around 0.28 per point here, so a plausible five-point measurement error shifts a result by 1.39, which is more than half the distance most arguments are about. An index with that much slack, taken from a thirty-year-old sample, cannot support an accusation about an individual.
- How much does a wrong body-fat reading change my FFMI?
- By your BMI divided by 100, per percentage point of error — a small identity worth memorising. For a man of 6 ft 1 in at 210 lb, BMI is 27.70, so every percentage point of body-fat error moves FFMI by 0.277. Three points of error move it by 0.83 and five points by 1.39. Put the other way: that same man, weighed and measured identically, scores 25.21 if his body fat is read as 9% and 22.99 if it is read as 17%. Nothing about his body changed between those two numbers. Since consumer methods routinely differ from each other by several points, the practical rule is to treat FFMI as accurate to roughly ±1 point in absolute terms, and to trust it much more as a trend measured the same way over time than as a single figure.
- When does the height normalisation actually matter?
- Only when you are far from 1.8 m, and even then it competes with the measurement error. The adjustment is 6.1 × (1.8 − height in metres), so it is worth +0.61 at 1.70 m, zero at 1.80 m and −0.61 at 1.90 m. Someone of 6 ft 1 in — 1.854 m — gets −0.33. Compare that with the roughly ±1 point of uncertainty coming from the body-fat estimate and it is clear the normalisation is a second-order correction for most people. It becomes worth applying when you are comparing across a group of noticeably different heights, or when your own number sits close to a value you are attaching meaning to — in which case the better move is to widen your uncertainty rather than to chase a decimal.
Articles you may find interesting
All guides →Related tools
FFMI is an index built on a body-fat estimate, not a measurement, and it describes a body rather than judging one. It is not a health assessment, not a diagnosis, and not a test for anything anyone has taken. If body weight or body shape is a source of distress for you, a doctor or a registered dietitian is a better place to take that than a calculator.
Sources
- Clinical Journal of Sport Medicine — Kouri, Pope, Katz & Oliva (1995), Fat-free mass index in users and nonusers of anabolic-androgenic steroids
- World Health Organization — Obesity and overweight — BMI definition and adult cut-off points
- Centers for Disease Control and Prevention — About Adult BMI — limitations of body mass index
- SportRxiv — Genetic Predisposition vs. Performance-Enhancing Drug Use and Fat-Free Mass Index in Strength-Trained Men (preprint)
Spotted a mistake in this article?