How Heart Disease Risk Scores Work — and Why They Disagree About You
Published 7/17/2026 · 6 min read · Health calculators

A cardiovascular risk score takes a handful of measurements and returns the percentage of people with your profile, in the population the model was built on, who had a cardiovascular event within ten years. The three most cited models ask for overlapping but different things: the 2008 Framingham general CVD score uses age, sex, smoking, systolic blood pressure, blood pressure treatment, total and HDL cholesterol and diabetes; SCORE2, the European Society of Cardiology's model, uses age, sex, smoking, systolic pressure and non-HDL cholesterol only, recalibrated to four European risk regions; the 2013 AHA/ACC pooled cohort equations use the Framingham inputs plus race. They also count different outcomes over the same ten years. That is why the same person can be told 6 percent by one and 11 percent by another, and why the score your clinician uses is the one that matters. None of them is a prediction about you — it is a frequency observed in a group you resemble.
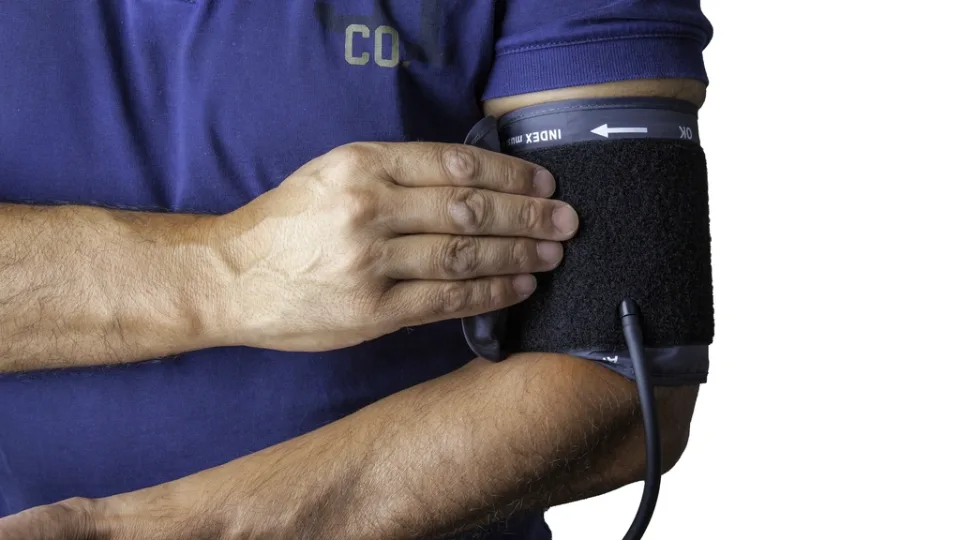
Framingham, SCORE2 and the pooled cohort equations use overlapping but different inputs and were calibrated on different populations, so the same person gets three different percentages. Here is what each one asks for and what the number means.
Why the same person gets three different percentages
Three things differ between the models, and each of them moves the answer. The inputs differ: SCORE2 does not ask whether you are treated for blood pressure, and it treats diabetes as a separate model rather than a checkbox. The outcome differs: a score that counts every first cardiovascular event returns a bigger number than one counting only heart attack, coronary death and stroke, over the identical ten years. And the calibration differs: each model was fitted to a population with its own background rate of disease.
Calibration is the reason Europe stopped using Framingham. Applied to low-risk European populations, the American equations systematically produced numbers that were too high, which is why the ESC built SCORE and then SCORE2, recalibrated separately for four European risk regions. The United Kingdom uses QRISK3 in its NHS Health Check for the same reason. The practical rule follows directly: a percentage is only meaningful with the name of its model attached, and the model worth trusting is the one your health system has adopted.
What a ten-year percentage actually says
A result of 12 percent means that of a hundred people with your recorded profile, in the population the model was built on, about twelve had an event within ten years and eighty-eight did not. It does not say which group you are in, and there is no calculation that can. This is a frequency in a crowd, borrowed and applied to one person, which is the only way population medicine can work — and it is worth stating plainly, because a percentage printed to one decimal place invites a precision it does not have.
Guidelines then attach thresholds to that number to decide who is offered preventive treatment, and the ESC sets those thresholds differently by age group rather than using one line for everyone. But a threshold is where a conversation starts, not where a decision is made automatically. Someone at 9 percent with a strong family history, chronic kidney disease or an inflammatory condition may be treated; someone at 11 percent with none of those may reasonably decide to change habits first and recheck.
The inputs that dominate, and the ones no model sees
Age carries more weight than anything else in every one of these models, followed by smoking and systolic blood pressure. That has an uncomfortable consequence and an encouraging one. The uncomfortable part is that a healthy sixty-year-old can score higher than an unhealthy forty-year-old, simply because age is the strongest term. The encouraging part is that the two biggest modifiable inputs are precisely the two that respond fastest: stopping smoking and bringing blood pressure down both move the estimate within months.
What no score can use is what it was never given. Family history, chronic kidney disease, rheumatoid arthritis and severe mental illness are handled by some models and ignored by others; QRISK3 includes several of them, and the American Heart Association's newer PREVENT equations added kidney function and body mass index while removing race as an input altogether. Feed any model a single blood pressure reading taken in a hurry and it will build a percentage on a number that was never real, which is why measurements are repeated before a risk conversation, not after it.
| Input | Framingham general CVD (2008) | SCORE2 (ESC, 2021) | Pooled cohort equations (AHA/ACC, 2013) |
|---|---|---|---|
| Age range covered | 30 to 74 | 40 to 69, with SCORE2-OP for 70 and over | 40 to 79 |
| Sex | Yes | Yes | Yes |
| Smoking | Yes | Yes | Yes |
| Systolic blood pressure | Yes | Yes | Yes |
| Currently treated for blood pressure | Yes | Not an input | Yes |
| Cholesterol | Total and HDL | Non-HDL only | Total and HDL |
| Diabetes | Yes | Not an input; SCORE2-Diabetes is a separate model | Yes |
| Race or ethnicity | No | No | Yes — separate equations for white and African American adults |
| What it counts as an event | Any first cardiovascular event in 10 years | Fatal and non-fatal cardiovascular events in 10 years | First heart attack, coronary death or stroke in 10 years |
| Population it is calibrated to | One long-running cohort in Framingham, Massachusetts | Four European risk regions, recalibrated for each | Pooled United States cohorts followed from the 1960s onwards |
Frequently asked questions
- Which score should I use?
- The one your health system uses, because that is the one your clinician can act on. Most of continental Europe uses SCORE2 and SCORE2-OP, the United Kingdom uses QRISK3 in the NHS Health Check, and the United States uses the pooled cohort equations, increasingly replaced by the PREVENT equations. A number produced by a foreign model is not wrong, but it is calibrated to somebody else's population and no local guideline attaches a threshold to it.
- My result is just below the treatment threshold. Does that mean I am fine?
- No. The confidence around an individual estimate is far wider than the gap between 9 and 11 percent, so a result on either side of a line carries almost the same information. Guidelines explicitly list risk modifiers — family history, chronic kidney disease, inflammatory conditions, deprivation — that move borderline people in either direction. Treat the threshold as the point at which the conversation becomes worth having, not as a verdict.
- Can I get a risk estimate without a blood test?
- Partly. Non-laboratory versions exist — the WHO publishes office-based charts that substitute body mass index for cholesterol — and they are designed for settings where blood testing is not available. They are noticeably less precise, because cholesterol is what makes an estimate specific to you rather than to your age group. If you can get a lipid panel and a properly measured blood pressure, do that first; the estimate built on them is the one worth discussing.
Articles you may find interesting
All guides →Related tools
This article is general information, not medical advice. Cycles, pregnancies and bodies vary; only a midwife or doctor who knows your history can tell you what is normal for you. Contact them about any symptom that worries you.
Sources
Spotted a mistake in this article?