Corrected Sodium, and Why Glucose Moves It
Published 3/24/2026 · 10 min read · Health calculators

Glucose that cannot get into cells stays in the extracellular fluid, where it is osmotically active. Water follows it out of the cells to restore osmotic balance, and that extra water dilutes everything already dissolved in the extracellular space — including sodium. The measured sodium therefore understates the sodium status of a hyperglycaemic patient, and the correction estimates what it would read if the glucose were normal. Two published factors exist. Katz, writing in the New England Journal of Medicine in 1973, derived 1.6 mmol/L of sodium per 100 mg/dL of glucose above 100 mg/dL. Hillier and colleagues, in The American Journal of Medicine in 1999, measured the effect experimentally and found 2.4, noting the discrepancy grows above 400 mg/dL. In SI those are 1.6 and 2.4 mmol/L of sodium per 5.6 mmol/L of glucose above 5.6 mmol/L. On a patient with sodium 128 and glucose 600 mg/dL (33.3 mmol/L), Katz gives 136.0 and Hillier gives 140.0 — a 4 mmol/L disagreement, on either side of a normal range boundary. This article explains why both numbers exist. It does not pick one, and it is not medical advice.
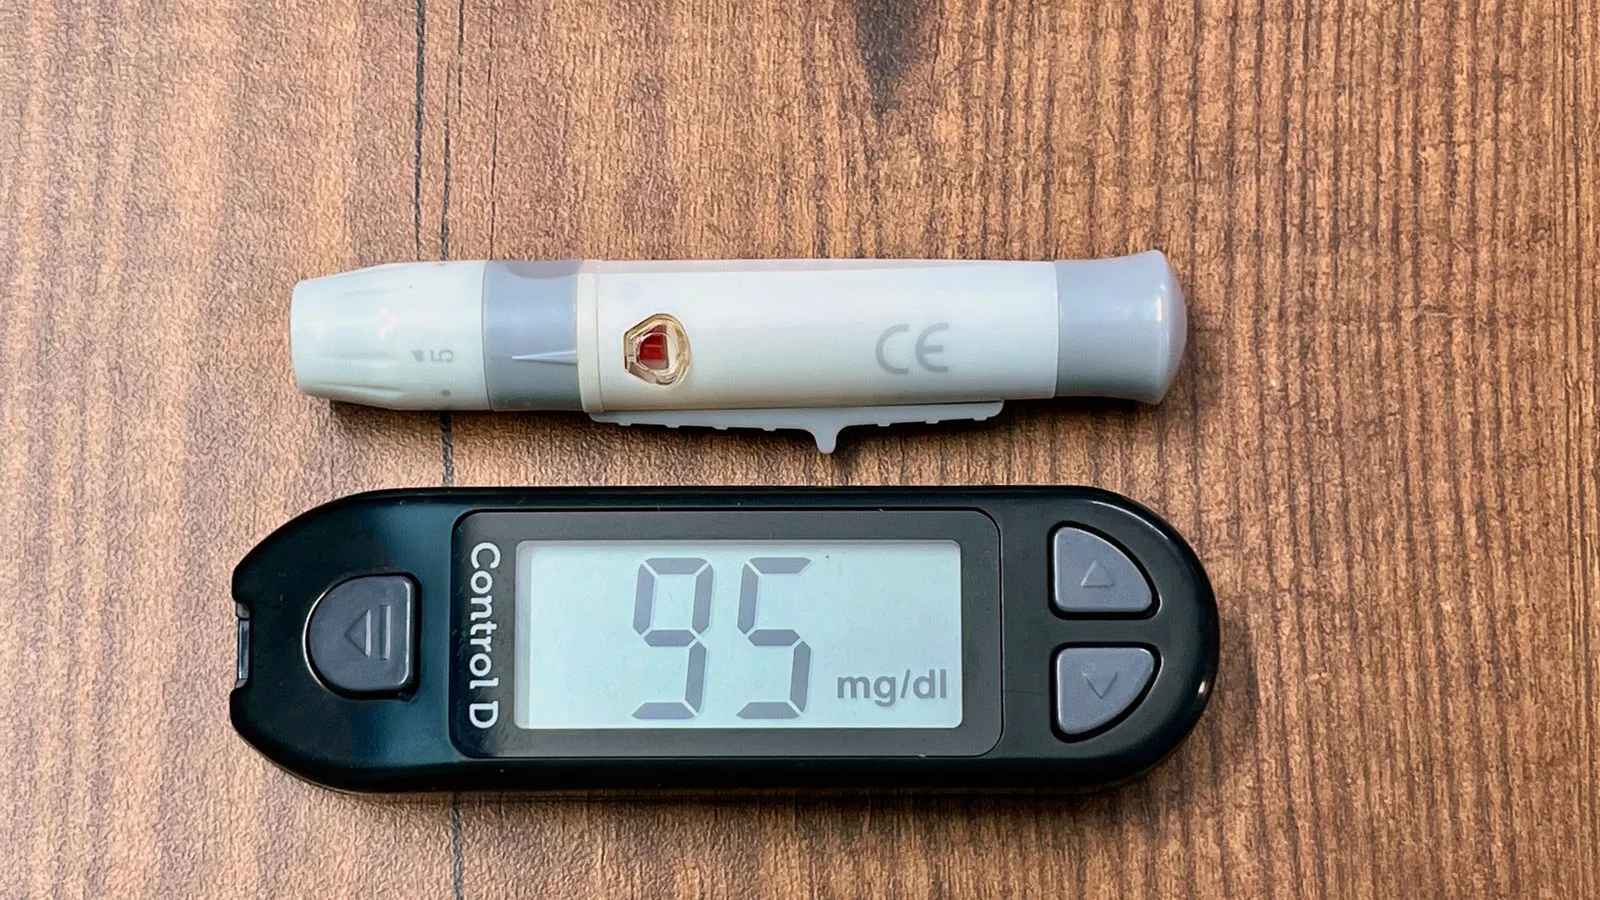
High blood glucose pulls water out of cells and dilutes the sodium in it, so a measured sodium in a hyperglycaemic patient reads lower than the real one. Here is the correction, both of the published factors, a case where they disagree by 4 mmol/L, and the different problem that lipids cause.
Water moves, and everything dissolved in it gets diluted
Cell membranes are freely permeable to water and not to glucose, which needs a transporter and, in most tissues, insulin to open one. When glucose accumulates outside cells because it cannot get in, it becomes an effective osmole: it exerts osmotic pressure that water responds to. Water leaves the cells and enters the extracellular fluid until the osmotic pressures balance again. Nothing has happened to the body's total sodium content. But the sodium that was there is now dissolved in more water, so its concentration — which is what a laboratory reports — has fallen.
That is the entire mechanism, and it explains the shape of the correction. It is proportional: the more glucose sits outside the cells, the more water it has drawn out, and the more the sodium has been diluted. It anchors at a normal glucose, because at a normal glucose there is no extra water to account for. And it is additive to the measured value, because the job is to put back the sodium concentration that the dilution hid. What the correction cannot do is tell you whether the patient's total body sodium is high, low or normal — that is a separate question about volume and losses, answered clinically.
Two published factors, and why neither is simply wrong
Katz published the classical figure in 1973 in the New England Journal of Medicine, deriving it from a theoretical model of fluid shifts: sodium falls by 1.6 mmol/L for every 100 mg/dL (5.6 mmol/L) that glucose rises above 100 mg/dL (5.6 mmol/L). That number went into textbooks and stayed there. In 1999 Hillier, Abbott and Barrett went at it experimentally in The American Journal of Medicine, infusing glucose in volunteers and measuring what actually happened to sodium. They found the fall was larger than the theory predicted, giving a factor of 2.4, and — this is the part that matters — that the underestimate grows worse as glucose rises, becoming pronounced above 400 mg/dL (22 mmol/L). The relationship is not truly linear; the 1.6 fits reasonably at moderate hyperglycaemia and increasingly badly at severe.
So the honest position is that Hillier fits the measured data better at high glucose, and Katz remains the textbook default at moderate glucose and in many institutional protocols. A number of calculators, including this site's, simply show both. That is not indecision. Both are estimates of a quantity nobody measures directly — what the sodium would read if the glucose were normal — and they answer with a spread. Reporting the spread is more informative than reporting either endpoint alone, and it makes it obvious when the two land on opposite sides of a decision boundary.
A case where the two factors disagree materially
Take a measured sodium of 128 mmol/L with a glucose of 600 mg/dL (33.3 mmol/L). In conventional units the glucose sits 500 mg/dL above the anchor, which is five correction units. Katz adds 5 × 1.6 = 8.0 and gives 136.0 mmol/L. Hillier adds 5 × 2.4 = 12.0 and gives 140.0 mmol/L. In SI the same case runs 33.3 − 5.6 = 27.7 mmol/L over the anchor, divided by 5.6 gives 4.95 units; Katz adds 7.9 for 135.9, Hillier adds 11.9 for 139.9. The 0.1 mmol/L gap between the two routes is nothing but the rounding of 5.551 to 5.6 — one rule, two unit systems, exactly as with corrected calcium.
Four millimoles per litre is not a rounding argument. One answer sits at or just below the bottom of a typical reference range and the other sits comfortably inside it, which is the difference between a corrected sodium that still looks abnormal and one that does not. Scale the case up and the gap widens with it: at a glucose of 800 mg/dL (44.4 mmol/L) with a sodium of 125, the two factors give 136.2 and 141.8, a 5.6 mmol/L spread. Scale it down and the gap closes: at 200 mg/dL (11.1 mmol/L) with a sodium of 132, they give 133.6 and 134.4, which is 0.8 apart and clinically indistinguishable. The disagreement is a function of how hyperglycaemic the patient is, which is exactly Hillier's finding restated.
Pseudohyponatraemia is a different problem with a different fix
There is a second way a sodium result can read falsely low, and it is not the one above. Plasma is roughly 93% water by volume; the remaining 7% is lipid and protein. Sodium is dissolved only in the water phase. Many laboratory analysers use an indirect ion-selective electrode, which dilutes the sample by a fixed ratio before measuring — a step that silently assumes the water fraction is the usual 93%. If it is not, because the patient has very high triglycerides or a paraprotein, the reported concentration is scaled wrongly.
The arithmetic is worth seeing because it shows how large the artefact can be. A patient whose true sodium in plasma water corresponds to 140 mmol/L reads 135.5 if the water fraction falls to 90%, 128.0 at 85%, 120.4 at 80% and 112.9 at 75%. Those last numbers look like life-threatening hyponatraemia and are not hyponatraemia at all — the sodium in the water where sodium lives has not changed. Crucially, the glucose correction does nothing for this. Pseudohyponatraemia is a measurement artefact and its fix is a measurement change: run the sample on a direct ion-selective electrode, which measures the undiluted water phase, typically the same electrode used in a blood gas analyser. Hyperglycaemic dilution, by contrast, is real physiology and needs the arithmetic, not a different machine.
The same shape as corrected calcium, for a different reason
Anyone who has met the albumin-corrected calcium formula will recognise the pattern here: a measured concentration, an interfering variable, a linear coefficient, an anchor value, and an adjusted result. The parallel is real and useful, and it stops at the mechanism. Corrected calcium adjusts for a binding problem — half the calcium in blood is stuck to albumin and inactive, so when albumin falls the total falls without the active fraction moving. Corrected sodium adjusts for a dilution problem — the sodium is all active, there is simply more water around it. One is about what the molecule is attached to; the other is about how much solvent it is dissolved in.
The shared lesson is the one worth carrying away from both. A corrected value is a modelled value: it is what an equation says the number would have been under conditions that did not obtain. It carries the error of the original measurement plus the error of the correction plus the error of the coefficient, and for sodium there are two published coefficients that disagree by up to several millimoles per litre in exactly the patients where the answer matters most. That is not a reason to distrust the correction. It is a reason to treat it as one input to a clinical judgement rather than as a result, which is precisely how the teams who use it treat it.
| Step | Katz 1973 (factor 1.6) | Hillier 1999 (factor 2.4) |
|---|---|---|
| Glucose above the anchor | 600 − 100 = 500 mg/dL | 600 − 100 = 500 mg/dL |
| Number of correction units | 500 ÷ 100 = 5.00 | 500 ÷ 100 = 5.00 |
| Sodium added back | 5.00 x 1.6 = 8.0 mmol/L | 5.00 x 2.4 = 12.0 mmol/L |
| Corrected sodium | 128 + 8.0 = 136.0 mmol/L | 128 + 12.0 = 140.0 mmol/L |
| How it reads against a typical range | Still at or just below the lower bound | Comfortably inside the range |
| The disagreement | 4.0 mmol/L apart — the whole reason both are published | Both are estimates of the same unmeasured quantity |
Worked with our own calculator
Corrected sodium calculator
Given
- Measured sodium (mEq/L)
- 260
- Serum glucose (mg/dL)
- 900
Result
- Corrected — Katz (1.6)
- 272.8
- Corrected — Hillier (2.4)
- 279.2
These figures are produced by the calculator below, not typed in by hand — they are recomputed whenever the tool changes.
Run it on your own figures →Frequently asked questions
- Which correction factor should I use, 1.6 or 2.4?
- This article deliberately does not choose, because the choice belongs to the clinical team and often to a local protocol. What can be said factually: Katz's 1.6 is the older theoretical figure and remains the textbook default; Hillier's 2.4 came from direct measurement in 1999 and fits the data better at high glucose, with the divergence becoming pronounced above 400 mg/dL (22 mmol/L). Showing both, and noting the spread, is more honest than showing one.
- Does correcting the sodium mean the patient is not hyponatraemic?
- No. The measured sodium is the real concentration in the patient's blood right now, and its physiological effects are real. The corrected value is a different thing: an estimate of where the sodium would sit once the glucose was brought down, which tells the treating team what to expect as treatment proceeds. Both numbers are used, for different purposes, by people who can see the patient. Neither is a diagnosis on its own.
- Why is the anchor 100 mg/dL and not the patient's own baseline?
- Because the correction is a population formula, not a personal one, and it needs a fixed reference to be reproducible between laboratories and between shifts. Choosing 100 mg/dL (5.6 mmol/L) simply sets the point at which the correction is zero. A patient's own habitual glucose is rarely known when the sample is taken, and using it would make two corrections of the same result incomparable. It is the same convention that fixes the reference albumin at 40 g/L in the corrected-calcium formula.
- How is pseudohyponatraemia different from this?
- Completely, despite looking identical on the report. Hyperglycaemic dilution is real: water genuinely moved and the concentration genuinely fell. Pseudohyponatraemia is an artefact of how some analysers dilute the sample; the sodium in the plasma water never changed, but very high lipids or proteins shrank the water fraction and the machine's fixed assumption about it broke. The glucose correction does not fix it and must not be applied to it. The fix is to re-measure on a direct ion-selective electrode.
- Can I use this to interpret my own blood test?
- No, and the situations where this correction is relevant are the strongest argument against trying. A markedly low sodium with a markedly high glucose is a medical emergency treated in hospital, where the correction is one number on a chart that also holds the volume status, the potassium, the acid-base picture and the rate at which everything is allowed to change. If you have a result that concerns you, take it to the clinician who ordered it — that is the shortest route to an answer that actually applies to you.
Articles you may find interesting
All guides →Related tools
This article explains how a laboratory correction is calculated. It is not medical advice and it cannot interpret anyone's result. The clinical situations in which this correction matters — very high blood glucose with a low sodium — are emergencies that are managed in hospital, not at a keyboard; the correction is one input among many for the team treating the patient. Reference ranges and correction conventions differ between laboratories, so take any report to the clinician who ordered it.
Sources
- New England Journal of Medicine (Katz MA, 1973) — Hyperglycemia-induced hyponatremia — calculation of expected serum sodium depression
- The American Journal of Medicine (Hillier TA, Abbott RD, Barrett EJ, 1999) — Hyponatremia: evaluating the correction factor for hyperglycemia
- American Diabetes Association — Hyperglycemic crises in adults with diabetes — consensus report
- Clinical Chemistry — Pseudohyponatremia and the effect of lipids and proteins on indirect ion-selective electrode measurement
- BMJ (Payne RB et al., 1973) — Interpretation of serum calcium in patients with abnormal serum proteins — the parallel correction
- European Federation of Clinical Chemistry and Laboratory Medicine — Recommendations on direct and indirect ion-selective electrode measurement of electrolytes
Spotted a mistake in this article?