ERA, FIP and WHIP: Three Answers to One Question
Published 12/9/2025 · 10 min read · Sport calculators

The three numbers answer three different questions. ERA = 9 x earned runs / innings pitched, and it records what actually crossed the plate, defence and sequencing included. WHIP = (walks + hits) / innings pitched, and it records how many baserunners a pitcher allowed, saying nothing about when. FIP = (13 x HR + 3 x (BB + HBP) - 2 x K) / IP + a constant, and it deliberately excludes every ball put in play, keeping only the outcomes a pitcher settles without help: home runs, walks, hit batters and strikeouts. That constant is not universal. It is recomputed for each league-season as league ERA minus the league's raw FIP, purely so FIP lands on the familiar ERA scale — in the illustrative league used here it works out to 3.21. Take a pitcher with 180 innings, 82 earned runs, 185 hits, 45 walks, 5 hit batters, 200 strikeouts and 18 home runs. His ERA is 4.10, his WHIP 1.28, and his FIP just 3.12. A second pitcher with 58 earned runs, 150 hits, 55 walks, 145 strikeouts and 22 home runs posts a 2.90 ERA, a 1.14 WHIP and a 4.15 FIP. ERA ranks the second man ahead by 1.20; FIP ranks the first ahead by 1.03. That disagreement is the useful part.
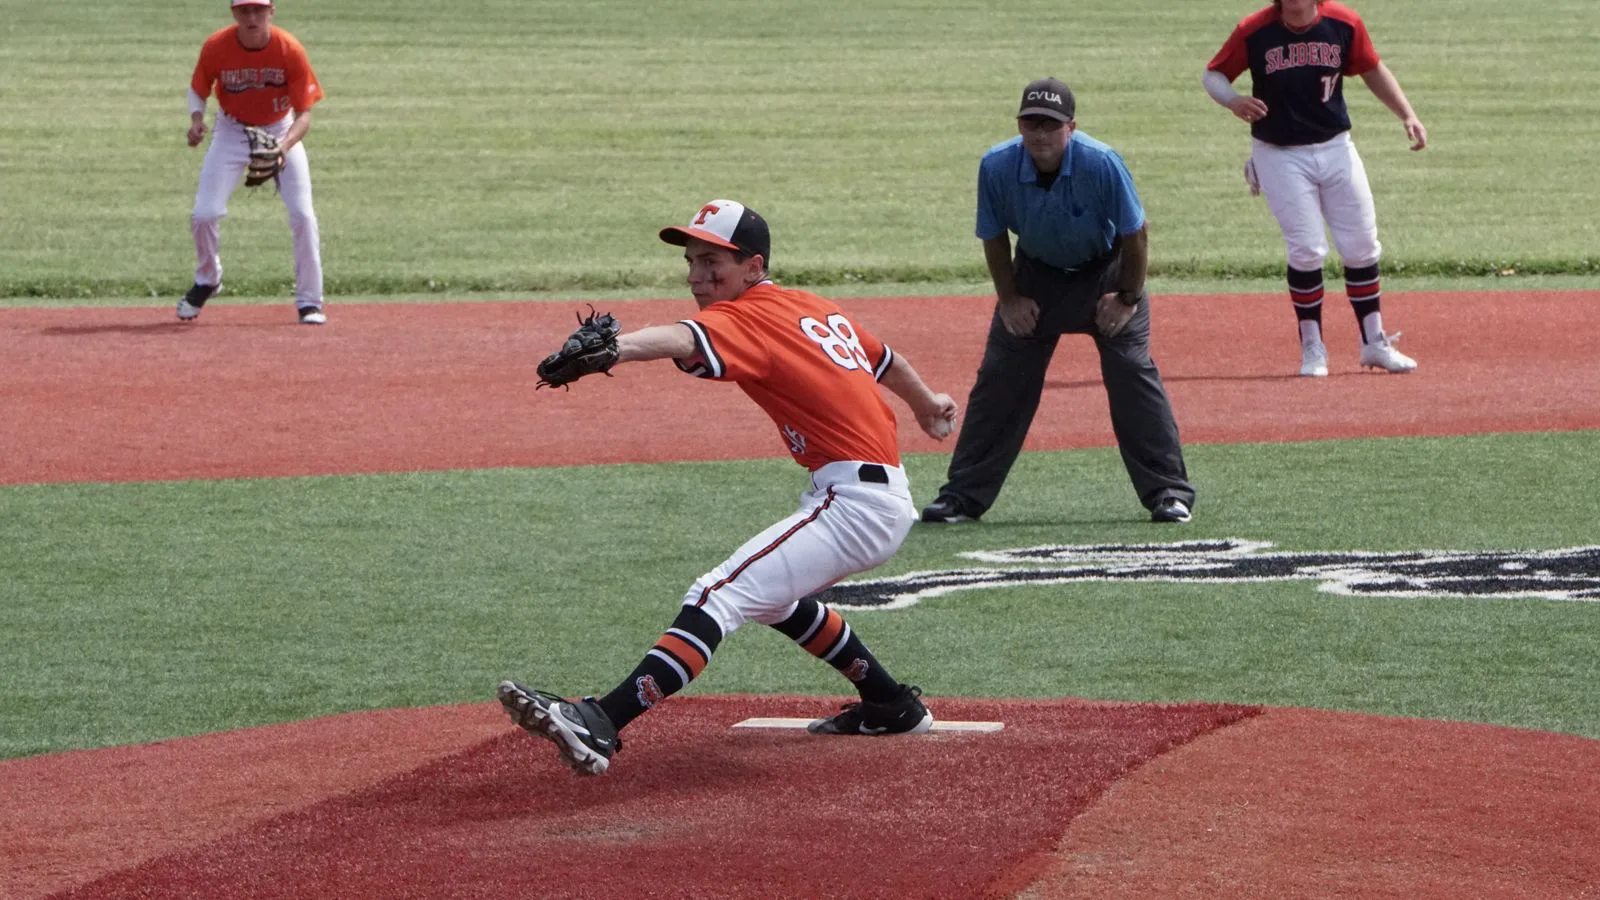
ERA measures what happened, FIP measures only what the pitcher controls without his fielders, WHIP measures traffic allowed. Two pitchers can swap places entirely between them — and the gap between ERA and FIP is a forecast, not a verdict.
One pitcher, three different questions
Arguments about pitching statistics are usually arguments about which question is being asked, conducted by people who each think the question is obvious. There are three sensible ones. How many runs actually scored while this man was on the mound? How many runs would have scored if his fielders had been perfectly ordinary? And how crowded were the bases while he worked? ERA answers the first, FIP the second, WHIP the third. None of them is wrong; they are simply not interchangeable.
The pitcher used throughout this article threw 180 innings, allowed 82 earned runs and 185 hits, walked 45, hit 5, struck out 200 and gave up 18 home runs. Everything below comes out of that one line, and the three metrics disagree about him strongly enough to change who you would sign.
ERA and WHIP: what happened, and how busy it was
ERA = 9 x earned runs / innings pitched. For our man, 9 x 82 / 180 = 4.10. The nine scales the answer to a full game, which is the only reason ERA reads like a plausible score. Note the qualifier: earned runs. A run that only scored because of a fielding error is excluded by official scorer's judgement, which means ERA already contains one hand-made defensive adjustment — an inconsistent and famously subjective one.
WHIP = (walks + hits) / innings pitched: (45 + 185) / 180 = 1.28. Read plainly, that is 1.28 baserunners per inning, or 11.50 per nine. WHIP knows nothing about sequencing — three singles in one inning and three singles across three innings give the same WHIP and very different scoreboards. It also omits hit batters and errors, so it is not a complete count of traffic. What it is good at is describing how often a pitcher works from the stretch, which is a real and separate thing from how many runs he allowed.
FIP: only the outcomes nobody else touches
FIP = (13 x HR + 3 x (BB + HBP) - 2 x K) / IP + constant. Every input is an outcome the pitcher settles by himself. A strikeout needs no fielder. A walk and a hit batter need no fielder. A home run leaves the field of play. Everything else — the ground ball that finds a glove, the line drive that finds a gap — depends on where eight other men were standing and how fast they moved, and FIP deliberately refuses to credit or blame the pitcher for any of it.
The coefficients 13, 3 and 2 are relative run values, not counts. A home run costs roughly thirteen times what a strikeout saves, a walk about three times, and the signs point the obvious way. Run the numbers: (13 x 18 + 3 x (45 + 5) - 2 x 200) / 180 = (234 + 150 - 400) / 180 = -0.0889. That negative figure is the raw FIP, and on its own it is meaningless as a run rate — which is precisely what the constant is for.
The constant is a scaling term, recomputed every season
The constant does one job: it moves the raw figure onto the ERA scale so that the two can be compared at a glance. It is defined as the league's ERA minus the league's raw FIP, which forces league FIP to equal league ERA by construction. In an illustrative league averaging a 4.20 ERA with 1.20 home runs, 3.20 walks, 0.45 hit batters and 8.80 strikeouts per nine innings, the raw league FIP is (13 x 1.20 + 3 x 3.65 - 2 x 8.80) / 9 = 0.994, so the constant is 4.20 - 0.994 = 3.21.
Because it is defined that way, it moves whenever the run environment moves. A low-offence league at a 3.74 ERA with 0.86 home runs, 2.90 walks, 0.33 hit batters and 7.70 strikeouts per nine yields a raw FIP of 0.608 and a constant of 3.13. A high-offence league at a 4.51 ERA with 1.39 home runs, 3.28 walks, 0.46 hit batters and 8.81 strikeouts yields 1.297 and a constant of 3.21. The commonly quoted figure of roughly 3.1 to 3.2 is a description of recent seasons, not a law. Use the constant published for the league-season you are describing, or your FIP is on the wrong scale.
With the constant at 3.21, our pitcher's FIP is 3.21 - 0.0889 = 3.12. His ERA is 4.10. On his own strikeouts, walks and home runs he behaved like a 3.12 pitcher and was charged like a 4.10 one.
The gap is a forecast, and its direction is the point
A large ERA-minus-FIP gap is not a scandal about the past. It is a statement about the future, and the direction is consistent: results tend to move toward FIP, not away from it. Our pitcher's gap is 4.10 - 3.12 = +0.98. At his FIP rate, 180 innings would have cost 62.4 earned runs; he was charged 82, nearly twenty runs more than his own strikeouts, walks and home runs account for. The reason is visible in one number: his batting average on balls in play was 0.329, well above the roughly 0.290 to 0.300 that most pitchers converge on. Expect that to fall, and his ERA with it.
The mirror case is more useful still, because it is the one that costs money. A second pitcher over the same 180 innings allowed 58 earned runs, 150 hits, 55 walks, 3 hit batters, 145 strikeouts and 22 home runs. His ERA is a glittering 2.90 and his WHIP a tidy 1.14, and his raw FIP is (13 x 22 + 3 x 58 - 2 x 145) / 180 = +0.944, giving a FIP of 4.15. At that rate his 180 innings should have cost 83.1 earned runs; he was charged 58. His BABIP was 0.245. Nothing about a 7.25 strikeout rate, a 2.75 walk rate and 1.10 home runs per nine supports a 2.90 ERA, and next season will say so.
Reading the three together
Use ERA to describe a season that has finished, because it is what actually happened and no amount of modelling changes the standings. Use FIP to forecast the next one, because the inputs it keeps are the ones that repeat. Use WHIP to describe workload and pressure, not run prevention. And notice that WHIP sides with ERA in our example — 1.14 against 1.28 — for the same reason ERA does: hits are in it, and hits carry all the defensive noise that FIP was built to strip out.
One caution worth holding. FIP treats every pitcher's home-run rate as fully his own, and home-run rate on fly balls is itself noisy over a single season. That is why xFIP exists: it substitutes a league-average home-run-per-fly-ball rate and rebuilds the number, which forecasts better for pitchers with unusual home-run luck but describes the season less faithfully. If FIP and xFIP disagree sharply about a pitcher, the argument is about his fly balls, not his command.
| Measure | Pitcher A | Pitcher B | What it is saying |
|---|---|---|---|
| ERA | 4.10 | 2.90 | B looks 1.20 better |
| FIP | 3.12 | 4.15 | A is 1.03 better |
| ERA minus FIP | +0.98 | -1.25 | A should improve, B should regress |
| WHIP | 1.28 | 1.14 | B allowed less traffic |
| Strikeouts per 9 | 10.00 | 7.25 | A misses far more bats |
| Walks per 9 | 2.25 | 2.75 | A is also tidier |
| Home runs per 9 | 0.90 | 1.10 | A gives up fewer |
| BABIP | 0.329 | 0.245 | The whole explanation |
Frequently asked questions
- What does an innings-pitched figure like 195.1 actually mean?
- The digit after the point counts outs, not tenths. 195.1 means 195 innings and one out, which is 195 and one third; 195.2 is 195 and two thirds. Anyone dividing 195.1 as a decimal will get every rate slightly wrong, and the error is largest for relief pitchers, whose totals are mostly thirds. Convert to thirds before you compute: 195.1 is 195.3333 innings.
- Is a lower FIP than ERA always good news?
- Usually, but not automatically. The honest reading is that some of the runs charged to the pitcher were not produced by his own strikeouts, walks and home runs — and the alternative explanation is his defence, not his luck. A pitcher in front of a poor fielding team will run an ERA above his FIP year after year, and no regression is coming while he stays there. Check whether the gap repeats before treating it as a forecast.
- Why does FIP include hit batters when ERA barely notices them?
- Because a hit batter is functionally a walk that the pitcher caused entirely on his own, with no fielder involved, and FIP's whole selection rule is defence independence. ERA notices a hit batter only if that runner eventually scores, which depends on eight team-mates and the next several hitters. FIP charges it immediately at the same weight as a walk, which is why the term reads 3 x (BB + HBP) rather than 3 x BB.
- Does WHIP add anything once you have ERA and FIP?
- It adds workload and context rather than run prevention. A pitcher with a good ERA and a high WHIP is escaping trouble repeatedly, which costs pitches, shortens outings and taxes a bullpen even when the scoreboard stays clean. It is also the statistic most directly tied to how a manager experiences a start. Just do not read it as a rate of runs allowed — it deliberately ignores when the baserunners arrived, and when is most of what turns runners into runs.
- Can I compare a FIP from one league with a FIP from another?
- Only if you know which constant each one used. Because the constant is set so that league FIP equals league ERA, two leagues with different run environments carry different constants — 3.13 and 3.21 in the two examples above. A FIP of 3.50 in a league with a 3.13 constant is a better performance than a FIP of 3.50 in a league with a 3.21 constant, by exactly the difference between the constants. If the source does not say which league-season it is scaled to, treat the number as unusable across leagues.
Articles you may find interesting
All guides →Related tools
Sources
Spotted a mistake in this article?