OPS Is a Flawed Sum, and Still the Most Useful Number on the Card
Published 12/8/2025 · 10 min read · Sport calculators

OPS is on-base percentage plus slugging percentage, and the two are not measured over the same thing. OBP = (H + BB + HBP) / (AB + BB + HBP + SF); SLG = TB / AB. One denominator counts plate appearances, the other counts at-bats. Adding them is like adding a rate per kilometre to a rate per mile, and no textbook would allow it. Take a season of 550 at-bats, 165 hits, 34 doubles, 3 triples, 28 home runs, 65 walks, 6 hit by pitch and 5 sacrifice flies. Total bases are 289, so SLG = 289 / 550 = 0.525. On-base events are 236 over a denominator of 626, so OBP = 0.377. OPS = 0.902 — a number produced by summing 236/626 and 289/550, whose denominators differ by 76. It survives because it works: it tracks team run scoring far better than batting average, and anyone can compute it from a standard box score in ten seconds. Its known flaw is direction, not size. Run-value studies weight a point of OBP at roughly 1.8 times a point of SLG; OPS weights them 1 to 1, so it systematically underpays patient hitters. That is why OPS+ and wOBA exist, and only wOBA fixes the weighting.
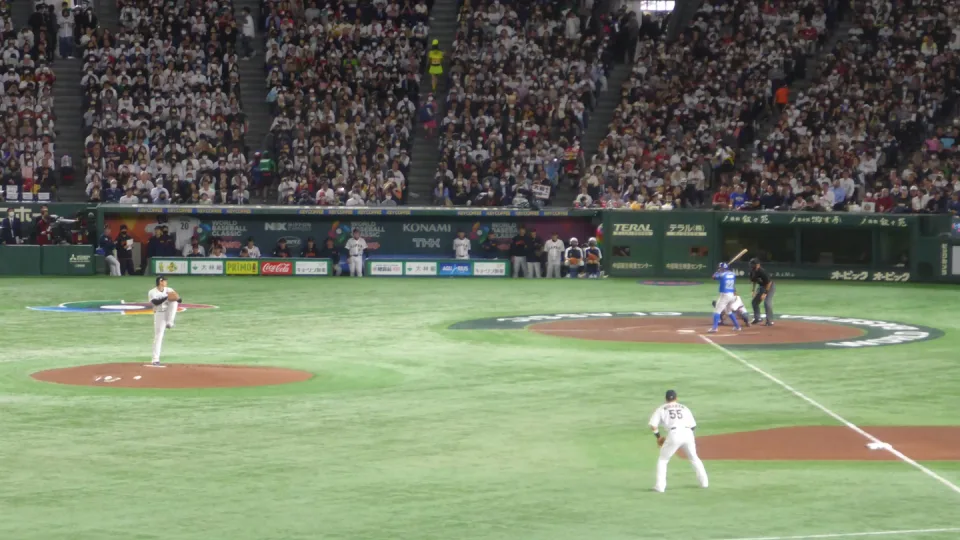
OPS adds two fractions with different denominators, which as arithmetic is indefensible. It survives because it tracks run scoring far better than batting average and costs nothing to compute — but it underpays on-base ability, and OPS+ does not fix that.
The arithmetic does not survive inspection
Two fractions can be added only when they describe the same denominator. On-base percentage divides by at-bats plus walks plus hit by pitch plus sacrifice flies — very nearly the plate appearance. Slugging percentage divides by at-bats alone. In the season worked above, one denominator is 626 and the other is 550. The sum 236/626 + 289/550 is not a rate of anything. It is two different rates stacked, and the stack has no unit.
There is a second, quieter incoherence. Slugging percentage is not a percentage at all: its numerator counts bases, not events, so its ceiling is 4.000 and not 1.000. On-base percentage really is bounded by 1.000. Adding a quantity capped at one to a quantity capped at four means the two halves of OPS cannot even move over comparable ranges. In practice they do, because nobody slugs 4.000 — but the scale is a coincidence of how baseball is played, not a property of the formula.
The three formulas, worked once
Total bases first, because both of the other numbers lean on it. TB = singles + 2 x doubles + 3 x triples + 4 x home runs, which is the same as H + 2B + 2 x 3B + 3 x HR. With 165 hits of which 34 are doubles, 3 triples and 28 home runs, there are 100 singles, and TB = 100 + 68 + 9 + 112 = 289. Slugging percentage is 289 / 550 = 0.525. Note what that number is: total bases per official at-bat, or bases per swing that counted.
On-base percentage counts arrivals, not bases: (165 + 65 + 6) / (550 + 65 + 6 + 5) = 236 / 626 = 0.377. Batting average, the number this replaced, is 165 / 550 = 0.300 and ignores the 71 times this hitter reached without a hit. OPS is 0.377 + 0.525 = 0.902. Every step is a division you could do in your head at the ballpark, which is exactly the point of the metric and the reason it beat better mathematics into the mainstream.
Why a broken sum survives
Because the thing it approximates is real. Runs are scored by not making outs and by advancing runners, and OBP measures the first while SLG measures the second. Adding them is crude, but it captures both halves of scoring in one number, and at team level it tracks runs per game far more closely than batting average does. Batting average throws away every walk; a lineup can lead a league in average and finish mid-table in runs, and repeatedly has.
The second reason is cost. Every input to OPS is printed on a standard box score, in every league, in every era back to the point where walks were recorded. wOBA needs a table of run values recomputed for the season you are looking at; win probability added needs play-by-play. OPS needs six integers and a pocket calculator. A metric that is 90 percent as good and 5 percent as expensive wins the argument in the stands, on the broadcast and on the back of the card, and that is where OPS lives.
The known bias: reaching base is underpaid
Work of the linear-weights tradition puts an extra point of on-base percentage at roughly 1.7 to 1.8 times the run value of an extra point of slugging. OPS pays them at 1 to 1. You can see the effect on a single event. Add one walk to the season above and OPS rises by 0.00099; add one single instead and it rises by 0.00185. OPS therefore prices a single at 1.87 walks. Run-value tables put a single at about 1.5 walks. The metric is not wrong about which is better, it is wrong about how much better.
The consequence shows up whenever two hitters arrive at the same OPS by different routes. The pair in the table both hit 0.276 and both post an OPS of 0.830. The patient one gets there with a 0.400 on-base and a 0.430 slugging; the power one with 0.316 and 0.514. OPS calls them identical. But the patient hitter reached base 244 times against 197, and made 366 outs against 426 — sixty outs the other one spent. Weight the two halves at 1.8 to 1 and the index reads 1.150 against 1.083, a gap of 0.067 that OPS reports as zero.
What OPS+ normalises, and what it leaves alone
OPS+ = 100 x (OBP / league OBP + SLG / league SLG - 1), then divided by the batter's park factor. It answers a different question from OPS: not how much this hitter produced, but how much he produced relative to the league he played in and the parks he played in. A value of 100 is exactly league average, 130 is thirty percent better. In a league at 0.320 on-base and 0.410 slugging, the patient hitter grades 130 and the power hitter 124. Move them both into a park that inflates offence by four percent and both fall — 125 and 119.
What OPS+ does not do is fix the weighting. It still adds two ratios one for one. There is a small accidental correction: because league on-base is a smaller number than league slugging, dividing by it amplifies the on-base half by league SLG divided by league OBP, or 0.410 / 0.320 = 1.281. That is a real nudge in the right direction, and it explains the six-point gap between two hitters OPS calls equal. But 1.28 is not 1.8. If you want the run values honoured properly, you need wOBA, which multiplies each event by its own measured run value instead of summing two rates and hoping.
Why a raw OPS cannot cross eras
An OPS of 0.830 is a fact about a hitter and a season together, never about the hitter alone. Split that 0.830 as an on-base of 0.377 and a slugging of 0.453. Set it against a low-offence league at 0.310 and 0.380, and OPS+ reads 141 — a genuinely excellent season. Set the identical line against a high-offence league at 0.345 and 0.450, and the same 0.830 reads 110, a good but unremarkable year. Nothing about the hitter changed. The comparison class did.
This is why any argument that quotes raw OPS across decades is arguing about the run environment, not about the players. Strike zones move, mounds move, ball construction moves, and the leagues that result are not the same test. Use raw OPS to compare team-mates inside a season, where the league and most of the parks are shared. Use OPS+ the moment the comparison crosses a season, a league or a ballpark — that is precisely the job it was built for.
| Measure | Patient hitter | Power hitter | Who leads |
|---|---|---|---|
| Batting average | 0.276 | 0.276 | Dead level |
| On-base percentage | 0.400 | 0.316 | Patient, by 84 points |
| Slugging percentage | 0.430 | 0.514 | Power, by 84 points |
| OPS | 0.830 | 0.830 | Dead level, by construction |
| Times on base | 244 | 197 | Patient, by 47 |
| Outs made | 366 | 426 | Patient, 60 fewer |
| 1.8 x OBP + SLG | 1.150 | 1.083 | Patient, by 0.067 |
| OPS+, neutral park | 130 | 124 | Patient, by 6 |
Frequently asked questions
- What counts as a good OPS?
- Only relative to the league, which is the whole reason OPS+ exists. Inside one modern season, a figure around the league average sits near 0.720 to 0.750, the 0.830 worked in this article is clearly above average, and 0.900 and up marks the best hitters on most rosters. Those anchors move with the run environment, so quote OPS+ instead if the comparison leaves the season you are looking at.
- Why do sacrifice flies count in OBP but sacrifice bunts do not?
- Because of a judgement about intent that the rules make explicit. A sacrifice bunt is treated as a play the batter was ordered to make, so it is removed from his record entirely — neither an at-bat nor an on-base denominator. A sacrifice fly is treated as a normal swing that happened to score a runner, so it stays in the OBP denominator as an out. It is a convention, not a derivation, and it is one of the reasons the OBP denominator is not exactly the plate appearance.
- Is wOBA simply better than OPS?
- As a measure of offensive value, yes — it multiplies every outcome by its own measured run value and divides by one consistent denominator, so it has neither of the faults described here. It is not free, though. Its weights are recomputed for each league-season, so you cannot check it from a box score and you have to trust the table you are using. OPS is the version you can verify yourself in ten seconds, and that is a real property, not a consolation.
- Can slugging percentage exceed 1.000?
- Yes. Its numerator counts bases and its denominator counts at-bats, so a hitter who homers in two of four at-bats has 8 total bases over 4, a slugging percentage of 2.000. The theoretical maximum is 4.000, from a home run in every at-bat. That is the clearest proof that it is not a percentage in any ordinary sense, and it is why adding it to a genuinely bounded rate like on-base percentage is arithmetically strange even though it is practically useful.
- Does OPS work for teams as well as for individuals?
- Better, in fact. Team OPS tracks team runs per game closely, because a full season of team plate appearances averages away the sequencing luck that distorts an individual line. At the individual level OPS is a description of production, not a forecast: two hitters with the same OPS can be worth different amounts to their lineup, which is exactly the case the equal-OPS pair in this article was built to show.
Articles you may find interesting
All guides →Related tools
Sources
Spotted a mistake in this article?